2024 Countywide Survey
Overview
In February 2024, the County sent out a survey to 7,000 randomly-selected households in the County, with a targeted response rate of about 14% (~1,000 responses). 1,103 people responded, or about a 15.8% response rate. The ETC Institute Survey team reviewed responses to ensure that the respondent pool roughly matches the actual racial, age, and gender demographics of the County according to the US Census Bureau. With this number of respondents, we can say with relatively high certainty that the responses are a good capture of the sentiments of the County's population overall.
Thank you to every participant who returned the survey! Your input and responses will help shape the future of the County by identifying priority areas and understanding the variety of experiences living, working, and visiting the County.


Priority Areas
In this survey, respondents were asked about a variety of key issues related to quality of life, including housing costs and options, walkability, access to cultural amenities, and more. For each question, respondents were asked to rate their current satisfaction with the issue or service, and also rank its importance as a priority across the next five years. The key areas which respondents felt should be top priorities in the future are:
1. Sense of physical safety
2. Quality of public K-12 education
3. Affordability of housing
4. Overall value received for County tax dollars and fees
5. Access to Parks and Open Spaces
These results line up with areas of strategic importance as identified in the Existing Conditions Report. Importantly, while some of these factors are outside of the County's control, the County must consider greater coordination with other organizations and services to address concerns identified by respondents.
Address Population Stagnation & Increase Social Resilience
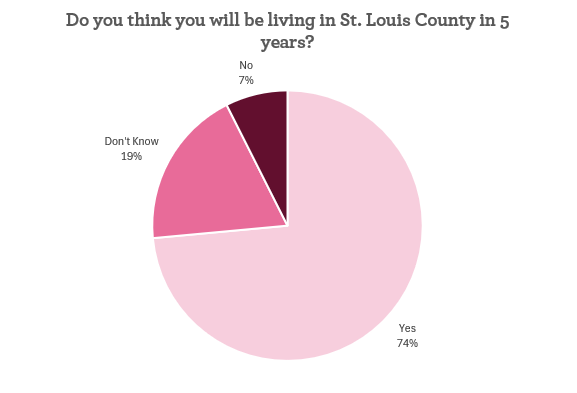
The County's population is stagnating, notably characterized by higher out-migration than inmigration. Only about 3/4ths of respondents in our County-wide Survey were certain they would still be living in St. Louis County in 5 years. Nearly 1/5th, or more than 200 of the 1,103 total respondents, were unsure. A variety of factors may be at play which contribute to this stagnation; the survey asked participants about several variables which will be explored below.
Safety
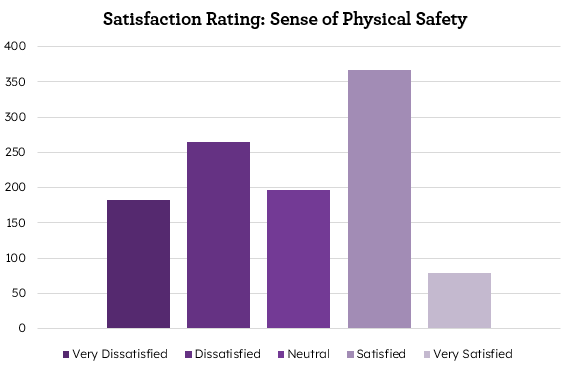
Perhaps unsurprisingly, more than half of all respondents named sense of physical safety a top 4 priority in the future. However, respondent satisfaction on sense of physical safety is mixed, with more than 40% of all respondents indicating satisfaction. This suggests that there may be demographic or geographic subgroups who experience safety in the County differently
Perception of Safety
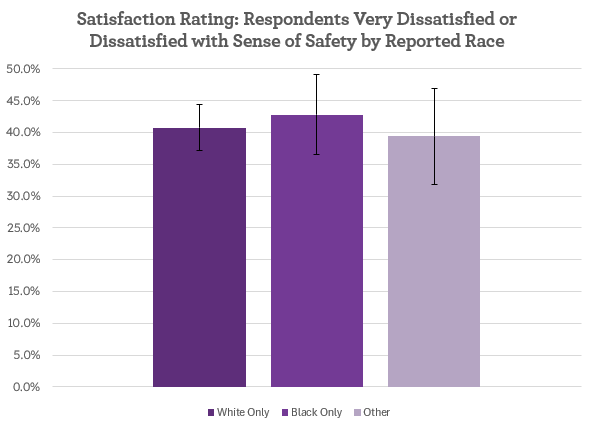
When filtering the respondent population by self-reported race, the respondent population's satisfaction rating for safety did not differ significantly across race. Due to the sample sizes, further research would be needed to determine the true relationship between the two.
In the St. Louis region, where there is a high degree of spatial segregation of experiences, investment, and services, future surveys and small-area studies may provide more insight into geographic differences in perception of safety.
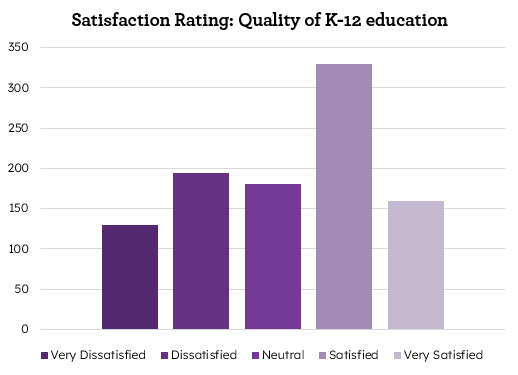
Quality of K-12 Education
K-12 education quality is a major factor in a family's decision to move to specific neighborhoods or regions. Like with safety above, respondents have a mixed response to satisfaction with the quality of K-12 education. Since K-12 public school districts are geographic, the bimodality of responses to this question suggests there is some disparity in quality across school districts in the County.
School district funding relies heavily on property taxes. See 2022 rates here.
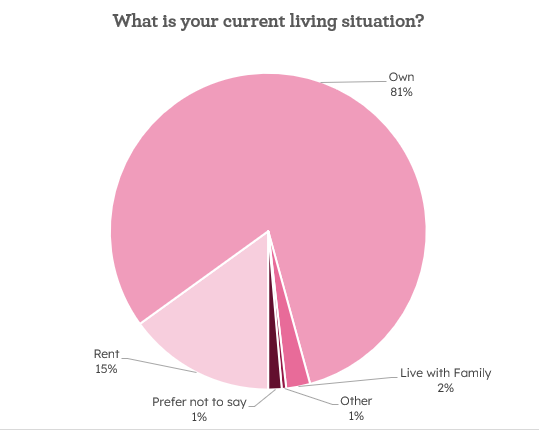
Increase Attainable Housing Stock
While the St. Louis area has benefited from relatively low cost of living compared to other major metropolitan areas, respondents overwhelmingly indicated general dissatisfaction with the housing affordability. Of note, 81% of respondents indicated that they are homeowners. This suggests that dissatisfaction with housing affordability is not only related to purchasing a home, but also the costs to maintain them.
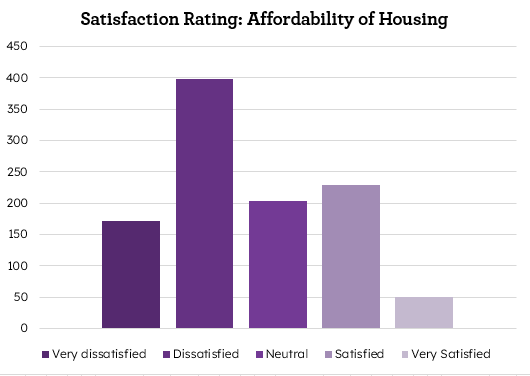
Housing Affordability
Respondents overwhelmingly indicated dissatisfaction with affordability of housing. Housing costs have been rising faster than income for the last two decades. As with other survey results, the distribution of responses suggests that there are at least two subgroups with differing experiences of life in the County
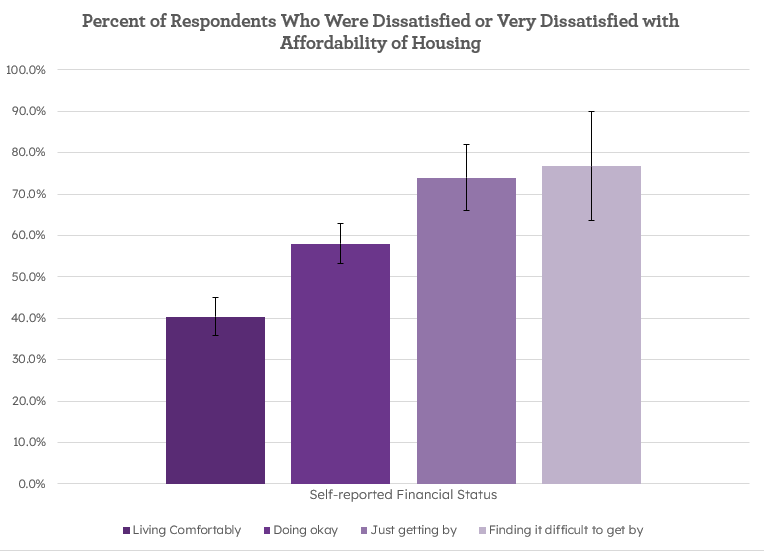
Housing Cost-Burden
When broken out by self-reported financial status, there is a marked difference in dissatisfaction regarding housing affordability. Those who identified as "Just getting by" or "Finding it difficult to get by" were significantly more likely to be dissatisfied with the cost of housing compared to people who reported "Living comfortably" or "doing okay". Thus, the most economically vulnerable respondents are the ones most likely to be cost-burdened by housing.
Physical Condition of Residences
879 people, or 79.7% of the 1,103 respondents, reported that they were satisfied with the physical condition of their home. Despite an aging housing stock, a lot of the existing housing stock is likely still in good condition or has been relatively well-maintained for its lifespan. Since housing in the inner ring of the County is more likely to be older, future studies could delve into whether geographic factors affect perception of physical condition of one's residence.
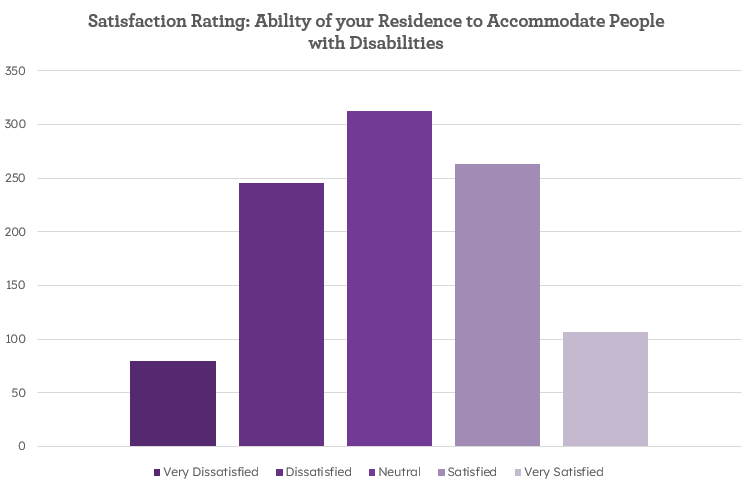
Inclusive Housing Options
Many respondents were neutral to very dissatisfied about the adequacy of their home to accommodate people with disabilities. Thus, there is still more opportunity to provide housing with better universal design and inclusivity throughout the County. For many areas which have aging housing stock, this will likely mean retrofitting buildings, but future construction should be more inclusive to people of different abilities.
Alleviate the Infrastructure Cost-Burden
As a result of the stagnating population and development of increasingly remote parts of the County, maintenance of the built environment is an increasing strain on taxpayers. Additionally, car dependence is extremely prevalent, with 607, or 55.03% of respondents, reporting exclusively using a car as their sole method of transportation. Only 3.0% of respondents do not use a car regularly at all. Such a built environment inhibits the movement of all populations, such as children and people who are disabled, who do not have the ability to drive.
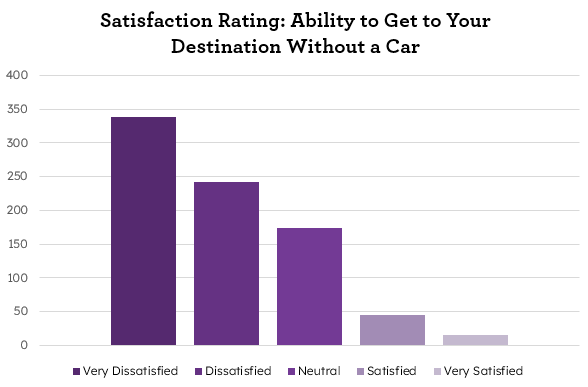
Transit Access
52.6% of all respondents reported that they are dissatisfied or very dissatisfied with their ability to get to their destination without a car. Thus, while many people are extremely car-dependent, that is not necessarily their preferred method to get to their destination. 289 of the 1,103 respondents, or 26.2%, did not answer this question or selected “don’t know”, suggesting that a notable proportion of respondents do not even attempt to seek out other methods of travel than cars.
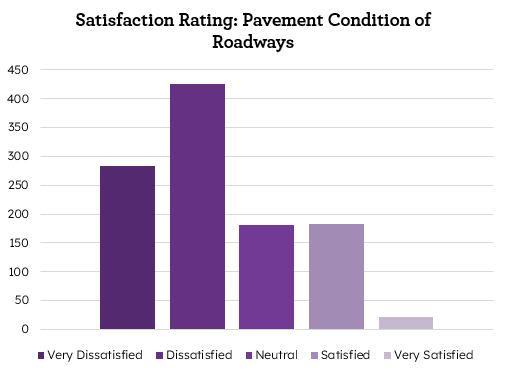
Pavement Conditions
A very large proportion of respondents noted dissatisfaction with the pavement condition of roads. This is consistent with anecdotal evidence presented by participants in other community input channels. The County’s roadways are strained by heavy car dependence and lack of funds to repair them.
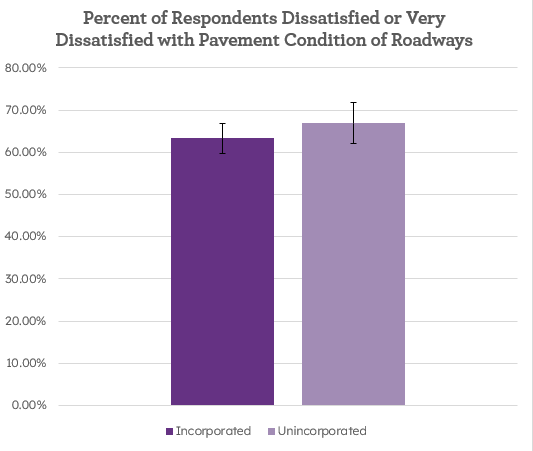
Countywide Road Conditions
When separating out respondents by whether or not they live in an incorporated or unincorporated area, there is no statistically significant difference in the percent of respondents who were dissatisfied to very dissatisfied with road conditions. This suggests the the issues created by car dependence and our current built environment is pervasive throughout, and the burden is not unique to respondents of municipalities vs. the unincorporated County. Thus, the roadway and infrastructure issue is something that requires coordination across jurisdictions.
Reduce the Jobs-Skills Mismatch
There are more jobs which require minimal training or specialized schooling than there are workers, and fewer specialized, high-skill jobs than there are workers. This suggests that not only does the job mix not reflect residents, but may also be fueling some of the other identified issues in the County. First, increasingly unaffordable housing prices mean that people with lower-skill jobs are living further from their workplaces. This matches with anecdotal experiences of workers moving to St. Charles County. Second, high-skill workers are also more likely to leave the County if they are unable to find a job that matches their skillset. Of note, about one-fifth of respondents to our survey live in the County but work elsewhere. Thus, the County and its surrounding region are interdependent.
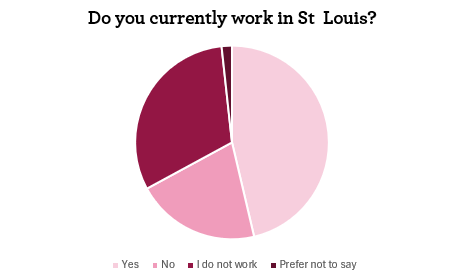
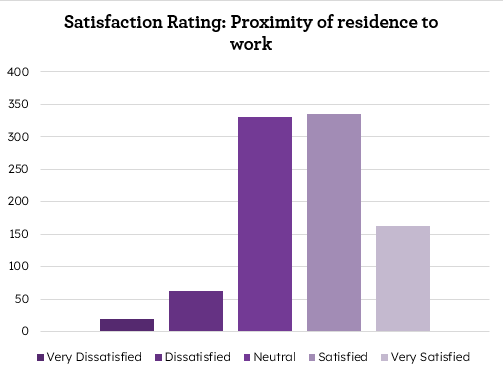
Job Access
Although many respondents were satisfied or very satisfied with their proximity to work, a big portion of respondents were neutral. Additionally, because we were unable to survey the population who works in St. Louis County and lives in a different county, these results only tell a portion of the full story.
Increase the County’s Ability to Weather the Storm
As climate events across the country become more severe and pronounced, it is of utmost importance that the County remains resilient to heat, flooding, and other environmental events.
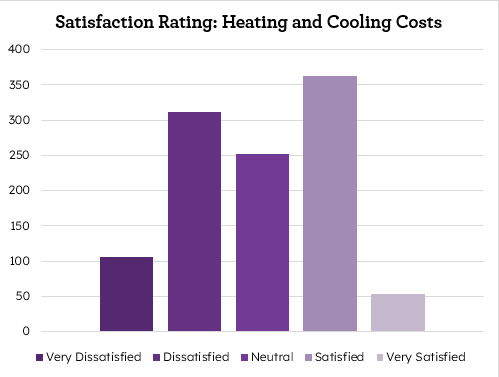
Heating & Cooling Costs
Similar to many of our survey questions, the satisfaction rate for the cost of heating and cooling one’s home displays a bimodal distribution, suggesting that there are two or more sub-populations which are experiencing this differently. Since the infrastructure in the inner ring of the County is markedly aged compared to the western portion of the County, it is possible that older buildings suffer more from energy inefficiency. As temperatures become increasingly unstable globally, the gap between affordable and unaffordable utility costs may increase.
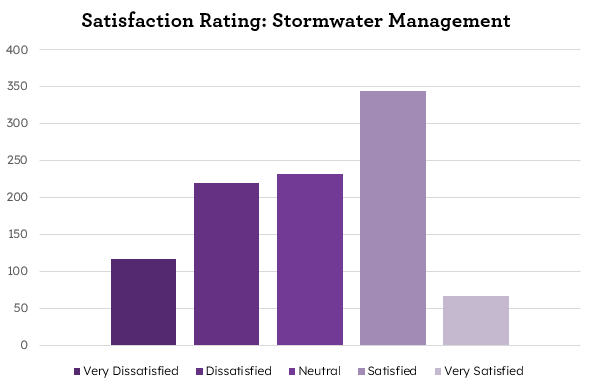
Stormwater Management
While many respondents indicated satisfaction with stormwater management in the County, large numbers of respondents were also dissatisfied and very dissatisfied. The irregular shape of this distribution suggests a similar phenomenon to above: it is likely that certain areas, which are more susceptible to flooding, are therefore less happy with the frequency and aftermath of flood events.